

These 1600 times were taken from the past 10 years, excluding 2020. There are 80 total times, with all 80 of those times being placers (1st-8th). There are ten first place times, ten fourth places times, etc…The idea behind this is to get a sense of where you will finish depending on the time you run. The numbers on the graphs are listed in seconds. Decimals were not used. For the girls, 300=5:00 minutes. For the boys, 260=4:20.
4A Girls 1600 Analysis
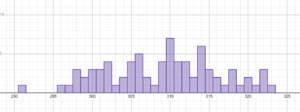


Mean-311.1 (5:11.1)
Median-310 (5:10)
Mode-5:10
The correlation coefficient is .66, so there is a strong relationship.
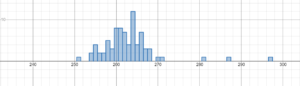
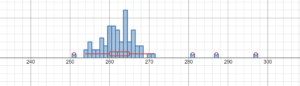
4A Boys 1600 Analysis
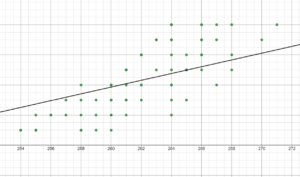
Correlation Coefficient is .64, so a strong correlation
Mean-262.84 (4:22.84)
Median-262 (4:22)
Mode-4:24 (12); 4:20 (8); 4:21 (8)